
Custom reports

Automate your PowerPoint reports

Show us your current report and we'll tell you whether we can automate its production.

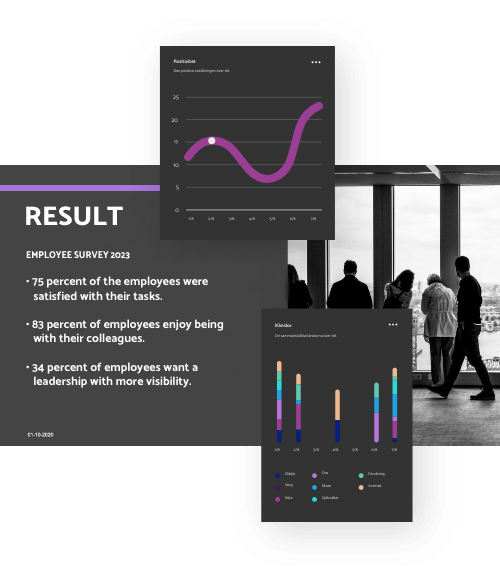
Report results on screen

Does this sound familiar?

Your reports, without the manual work

  • You want to automate the production of your organisation's PowerPoint reports.
  • Keeping the layout consistent with your existing reports is crucial.

Book a meeting, show us your current report and get a quote!

Book a meeting
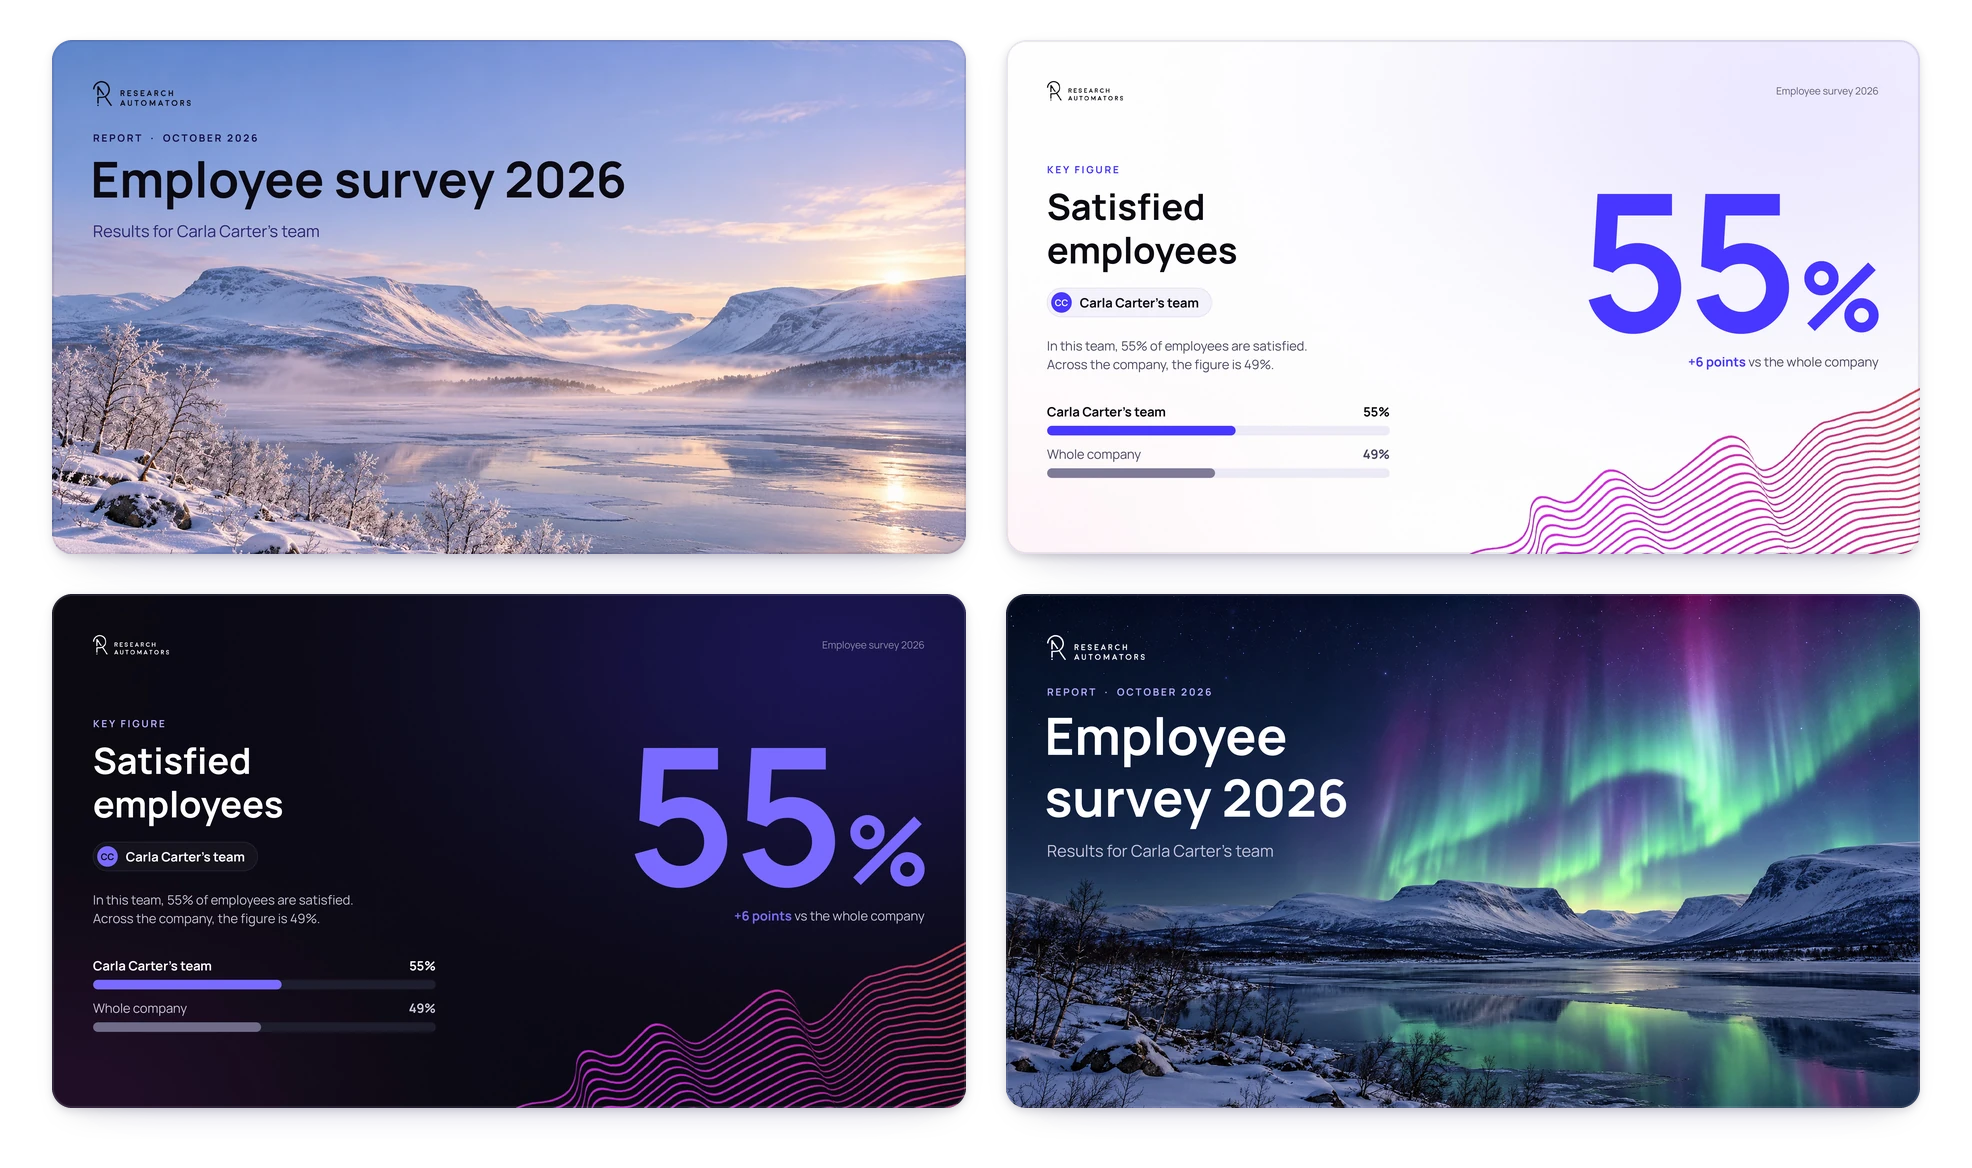
The same report in different PowerPoint themes

Your PowerPoint theme

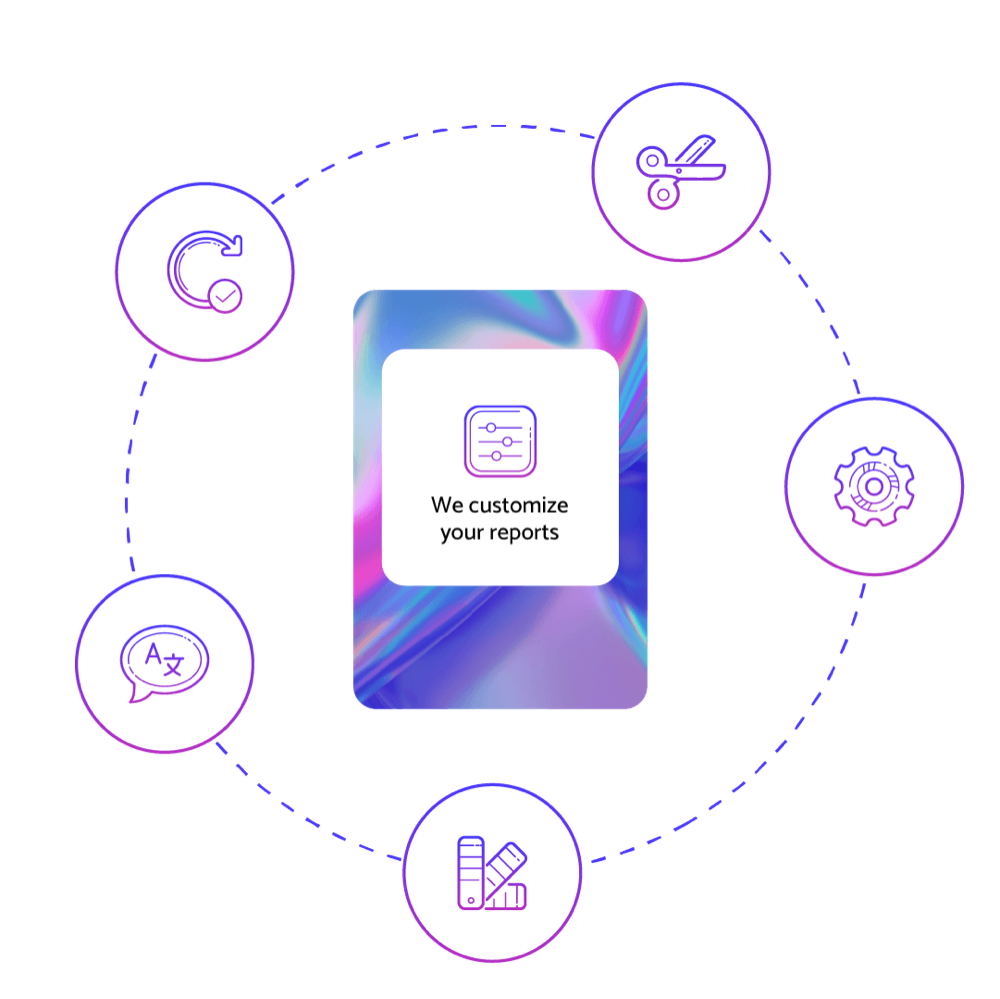
Your layout, fonts and colours

We create the PowerPoint reports in your organisation's layout, with fonts and colours according to your design.

All our charts are native PowerPoint charts – not images.

It's that simple

From files to finished reports in three steps

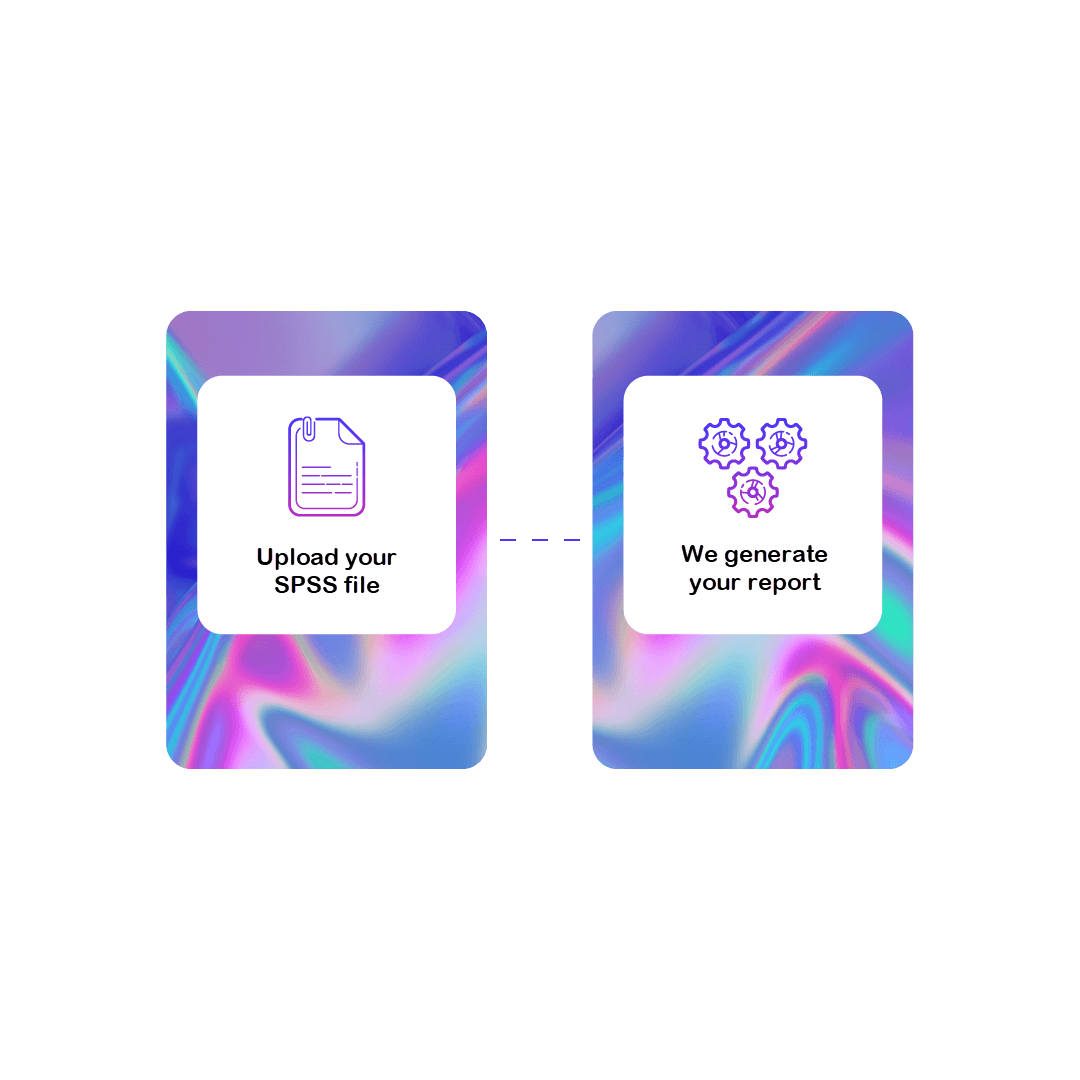
1 Files

Send us your files

All we need from you is the data from your survey (SPSS), your PowerPoint design – and, if you want us to imitate a report you created before, that report.

When we have your documents, we hold a start-up meeting to discuss your needs and ideas for the reports.

2 Sample report

We produce a sample report

You approve a sample report before we produce the final reports. We know which visualisations work best for different question types and which comparisons are usually relevant. If you have earlier reports you want us to imitate, we use them as the basis.

Within a couple of days you have a first report version.

3 Delivery

We create your reports

Once the sample report is approved, we create your reports. Have an updated raw data file? No problem – send it first and we'll use it for the final reports.

Within a couple of days you have your finished reports!

Frequently asked questions

Where is my data stored?

Your data is stored safely on our servers in Sweden.

What happens to my data and reports once the report is finished?

Your data and reports are stored and can be downloaded up to 12 months from the creation date. If you have a platform license, the data is kept until you either delete it manually or terminate your license.

Can you mimic any report layout and charts?

Not everything, but we can recreate most of the native charts in Microsoft Office.

Are you providing professional services or a platform?

Both. Our professional services team implements your report layout. Afterwards you can either continue buying our services or license the platform to create new reports on your own.

Can you automatically include advanced statistical calculations in the reports?

Yes, the platform supports significance tests, correlation, 0–100 averages, Top 2 Box, index calculations and more.

Can AI be used in the reports?

Yes. AI (via the OpenAI integration) can describe charts and tables, write headlines or analyse open ends / verbatims. How we use AI.

Is there a limit on the number of reports that can be produced from a data set?

Not really. We're used to very large report projects with several thousand reports, such as employee studies in large organisations.

How do you deliver the reports?

You get access to a dashboard where you can download all the PowerPoint reports as a zip file. If you like, each report recipient can get a unique login to download their own reports.

Workshop around a whiteboard

Discuss your PowerPoint needs with us

Get in touch and we'll make your report creation more efficient.